In this ecommerce statistics overview, you’ll find all the key facts from the world of online selling: data on global ecommerce, the average spend of ecommerce shoppers, leading ecommerce platforms, social ecommerce and much more…
Please note: you are free to use any of the ecommerce statistics featured in this post in your own articles. However, we’d politely request that you credit Style Factory as a source and provide a link to this post when doing so. Thank you!
Article highlights
- What is ecommerce?
- What types of ecommerce business models are there?
- What is the compound annual growth rate of ecommerce businesses?
- What are the fastest growing ecommerce countries?
- What is the average spend of ecommerce shoppers?
- Global ecommerce statistics
- US ecommerce statistics
- Ecommerce platform statistics
- Ecommerce marketplace statistics
- Social ecommerce statistics
- Mobile ecommerce statistics
- Ecommerce marketing statistics
- Ecommerce shipping statistics
- Ecommerce abandoned cart statistics
- Ecommerce dropshipping statistics
What is ecommerce?
- Ecommerce — short for ‘electronic commerce’ — is generally defined as the buying and selling of goods and services using the Internet. And there is very little you cannot get your hands on via ecommerce: houses, horses, hair extensions and hat pins are all available for purchase online from tens of millions of stores and marketplaces. (Source: Investopedia.)
- The term ‘ecommerce’ was first used in 1984 by Dr Robert Jacobson, Principal Consultant to the California State Assembly’s Utilities & Commerce Committee. (Source: Wikipedia.)
What types of ecommerce business models are there?
- Some commentators claim that there are 6 types of online business models:
- B2C: Business-to-Consumer
- C2B: Consumer-to-Business
- B2B: Business-to-Business
- C2C: Consumer-to-Consumer
- B2A: Business-to-Administration
- C2A: Consumer-to-Administration.
- However, within any one ecommerce model, there are arguably tens and tens of ‘sub-models’ of ecommerce business, including dropshipping businesses, subscription services and white-labelling.
- The vast majority of ecommerce businesses employ a business-to-consumer (B2C) or business-to-business (B2B) ecommerce model. (Source: Research and Markets.)
- By 2028, it is projected that the B2B ecommerce market will be worth over $25 trillion — more than three times the size of the B2C market. (Source: Research and Markets.)
What is the compound annual growth rate of ecommerce businesses?
- Between 2020 and 2027, B2C ecommerce businesses are projected to have a ‘compound annual growth rate’ (CAGR) of 8.4%. (Source: Research and Markets.)
- In China, the world’s second largest economy (but largest ecommerce market), CAGR is forecast to grow at an average CAGR of 14.3% over the same period. (Source: Research and Markets.)
What are the fastest growing ecommerce countries?
- Mexico is currently the country with the fastest ecommerce sales growth, with an annual growth rate in online ecommerce sales of 25%. (Source: Statista.)
- Six of the fastest growing ecommerce countries are in Asia, lead by the Philippines with an annual retail ecommerce growth rate of 24.1%. The other Asian countries in the top ten ecommerce growth countries are: India (22.3% growth rate), Indonesia (20% growth rate), Malaysia (18.% growth rate), Thailand (16% growth rate), Vietnam (12.5% growth rate), and South Korea (10.6% growth rate). (Source: Statista.)
What is the average spend of ecommerce shoppers?
- The average spend per visit for online shoppers across all product verticals in the third quarter of 2024 was only $2.61 per purchase. (Source: Statista.)
- ‘Health & Beauty” is the product category with the highest average spend, with an average of $3.02 spent per visit, followed by ‘home appliances’ with an average spend of $2.66. (Source: Statista.)
- Don’t let these numbers put you off starting your own ecommerce store — the ‘average order value’ (AOV) for a Shopify store is reportedly $85 per order, with the top-performing 20% and 10% of Shopify ecommerce stores having an AOV of $192 and $311respectively. (Source: Little Data.io.)
Global ecommerce statistics
- Global retail ecommerce sales totalled $6.09 trillion for 2024. This represents around 20% of retail sales (online and offline). (Source: Shopify.)
- It is forecast that worldwide ecommerce sales will be worth $9.4 trillion by 2026. (Source: Statista.)
- In 2024, Asia dominated as the largest e-commerce market globally, with its total online retail revenue nearing 2 trillion U.S. dollars. This figure surpassed the Americas’ e-commerce revenue by about 500 million U.S. dollars. In contrast, regions such as Australia, Oceania, and Africa reported significantly smaller e-commerce revenues, each below 50 billion U.S. dollars. (Source: Statista.)
- There are estimated to be more than 26.5 million ecommerce sites in existence. (Source: Doofinder.)
- The top three ecommerce countries in terms of total revenue from online sales are China, the US and Japan. China’s total ecommerce revenue for 2024 was $1.47 trillion, compared to $1.22 trillion. (Source: Statista.)
- As of June 2024, it was estimated that there are 904 million digital shoppers (over 44% of the global total of ecommerce shoppers). (Source: Statista.)
- By 2027, it is estimated that there will be 1.33 billion ecommerce shoppers in China. (Source: Statista.)
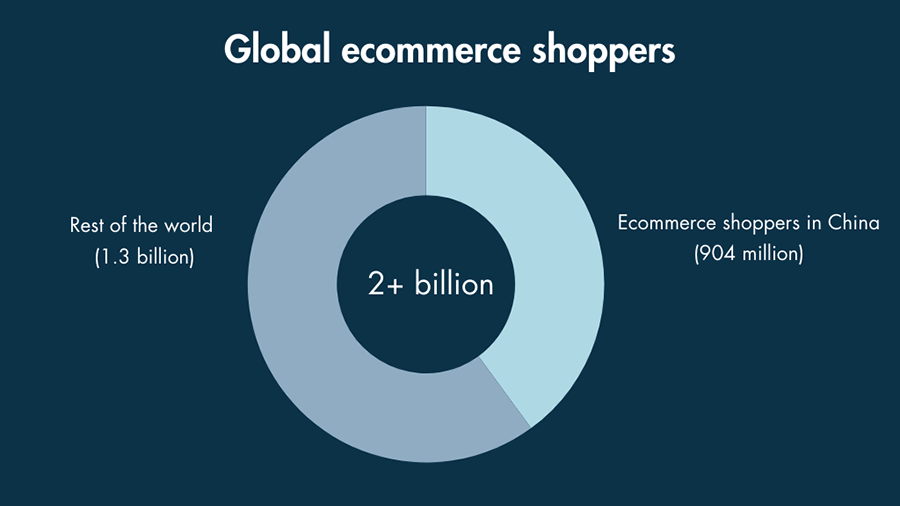
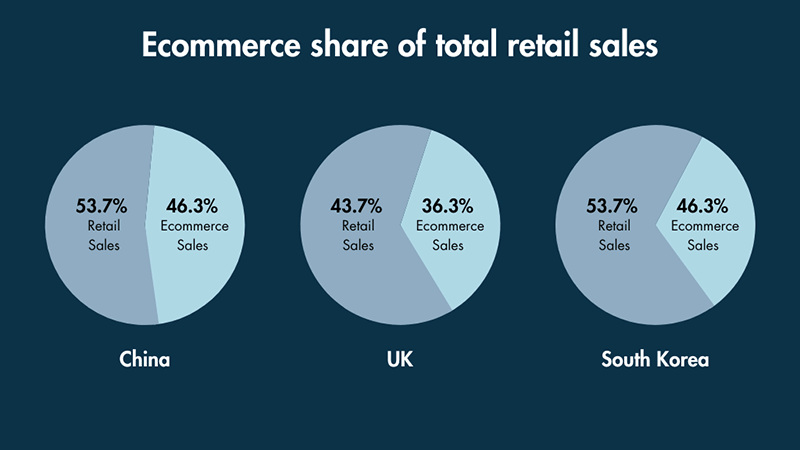
- China is also the country with the largest proportion of ecommerce retail sales in its overall retail market — with ecommerce sales representing 46.3% of all Chinese retail sales. (Source: Insider Intelligence.)
- From January to July 2024, online retail sales in China reached 8.38 trillion yuan, marking a 9.5% year-on-year increase. Notably, online retail sales of physical goods accounted for 25.6% of the total retail sales of consumer goods during this period. (Source: NBSC.)
- In China, the e-commerce user penetration rate is expected to reach 42.4% by 2025, climbing further to 49.1% by 2029. (Source: Statista.)
- The average revenue per user (ARPU) in China’s e-commerce sector is projected to amount to $1,728.00. (Source: Statista.)
- The UK’s online retail sales represent a sizeable chunk of its overall retail figures — 36.3% of the UK retail market. (Source: Insider Intelligence.)
- South Korea, Denmark and Indonesia make up the rest of the top five for ecommerce share of national retail markets, with online sales representing 32.2%, 20.2% and 20.2% of their overall retail markets respectively. (Source: Insider Intelligence.)
- Perhaps surprisingly, the US and Canada are placed 7th and 10th in this category, on 16.1% and 13.6% respectively. (Source: Insider Intelligence.)
- When it comes to share of the global retail ecommerce market as a whole, China’s 52.1% portion puts it more than 33% ahead of the United States with its 19% share. (Source: Insider Intelligence)
- The top three global ecommerce market share countries — China, the US and the UK — have a combined control over 75% of the market as a whole. (Source: Insider Intelligence)
- You can see the full top ten countries in terms of overall ecommerce market share in the infographic below:
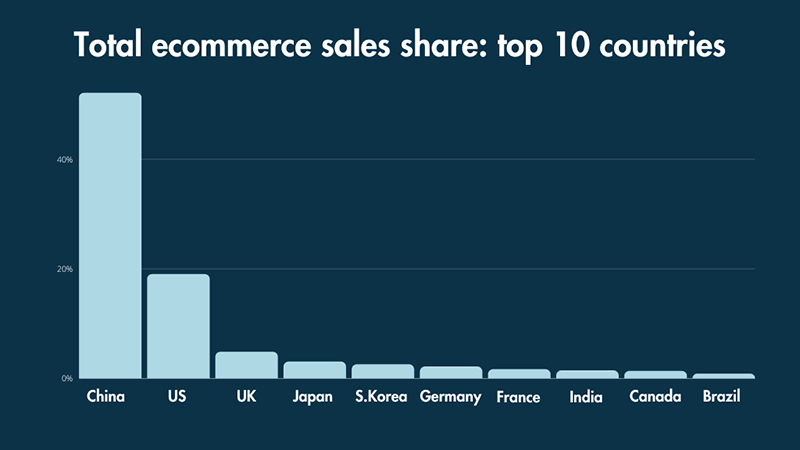
- Although tenth place Brazil only has a 0.8% share of the global ecommerce market, this share is growing fast. The Latin American ecommerce powerhouse’s online revenue doubled between 2019 and 2021, and Statista reports that Brazil has a very significant 29.5% share of Latin America’s ecommerce market. (Source: Insider Intelligence)
Speaking of ecommerce countries that are making big moves…
US ecommerce statistics
- In 2024, U.S. e-commerce sales continued to grow, with estimates indicating a total of approximately $1.2 trillion for the year, reflecting a 9.8% increase over 2023. (Source: Fit Consulting.)
- In the third quarter of 2024, adjusted U.S. retail e-commerce sales reached $300.1 billion, accounting for 16.2% of total retail sales. This represents a 2.6% increase from the previous quarter and a 7.4% rise compared to the same period in 2023.(Source: US Census Bureau.)
- US ecommerce sales in 2023 were estimated at $1.1 trillion, an increase of 7.6 percent from 2022. (Source: US Census Bureau.)

- The three most popular ecommerce retail product categories in the US are clothing and apparel, shoes and consumer electronics. 53% of online consumers bought clothing, while shoes and electronics were bought by 42% and 30% of shoppers respectively. Food, beauty goods and entertainment products (books, movies, music and games) were each purchased by 28% of American ecommerce shoppers. (Source: Mailchimp)
- In terms of the revenue generated by specific ecommerce categories in the US, ‘consumer electronics’ and ‘apparel and accessories’ accounted for $423+ billion in combined sales from April to March 2021. See the table below for the top five ecommerce categories in the US. (Source: Mailchimp)
| Consumer Electronics | $219.33 billion |
| Apparel and Accessories | $203.75 billion |
| Furniture and Decor | $129.45 billion |
| Health, Personal Care, and Beauty | $111.03 billion |
| Auto and Parts | $86.26 billion |
- Amazon is the most popular ecommerce search engine in the United States. 61% of US consumers start their online shopping searches on Amazon. Google’s search engine ranks second, used by 49% of people starting shopping searches; Walmart comes in third, with 32% of ecommerce shopping journeys started there. (Source: Insider Intelligence.)
- In the second quarter of 2024, ecommerce sales rose to 16% of total US retail sales. (Source: Statista.)
- The yearly growth rate for US ecommerce sales is forecast to average out at 7.8% over the four-year period from 2023 to 2027. (Source: ecommerce DB.)
- The top 3 online stores in the US are headed by Amazon, with $130 billion in net sales in 2022; Walmart is second with $53 billion; and Apple in third place with around $30 billion. (Source: Statista.)
- In December 2024, the U.S. eCommerce market generated monthly revenue of $107.4 billion, marking a 3.4% increase compared to November 2024. (Source: EcommerceDB.)
- December 2024 accounted for the highest monthly revenue share of the year, contributing 10.4% of the total annual eCommerce revenue in the U.S. (Source: EcommerceDB.)
- February 2024 saw the lowest monthly revenue share, representing only 7.1% of the total U.S. eCommerce market revenue for the year. (Source: EcommerceDB.)
Ecommerce platform statistics
An ecommerce platform is software that allows individuals and brands to create their own ecommerce website. These platforms — such as Shopify, BigCommerce and Wix — provide ecommerce merchants with customizable templates for designing their store, integrated payment systems, and the option to integrate a range of apps that provide additional selling features to their stores. They usually facilitate point of sale selling too.
By contrast, ecommerce ‘marketplaces’, which we discuss in the next section, are more like a huge online supermarket where you sell goods alongside those of your competitors. Online marketplaces like Amazon and eBay are generally quite restrictive in terms of how you sell your products; but the upside of marketplaces is that they provide merchants with a large, ready-made audience of high-intent buyers.
Here are some ecommerce platform statistics you need to know:
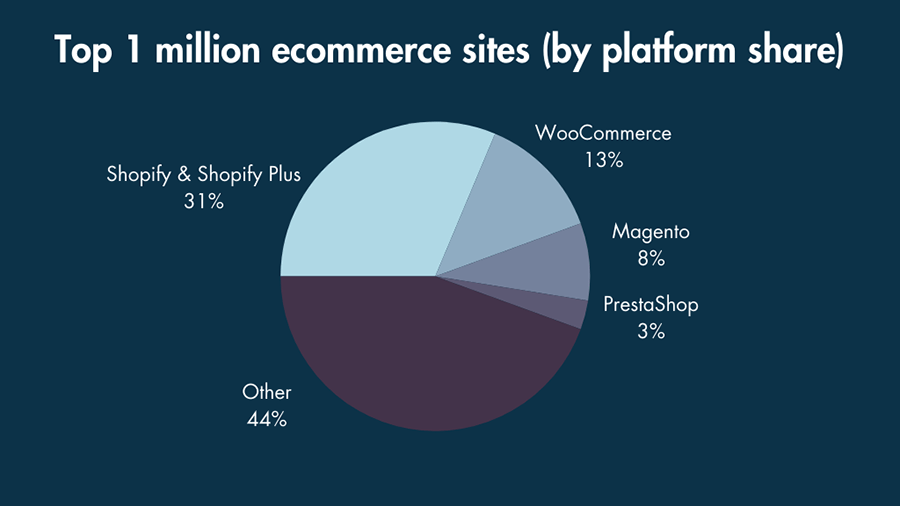
- Among the web’s top 1 million sites, Shopify is currently the most popular ecommerce platform — it’s used by 31% of them to sell goods. (Source: Builtwith.)
- WooCommerce is in second place, with a 13% share of the world’s top one million ecommerce sites. (Source: Builtwith.)
- As for overall ecommerce platform market share, WooCommerce ranks first with 39% of the total market, followed by Squarespace (14.75%) and Woo Themes (13.96%). (Source: Statista.)
- In the US, Shopify is used by 30% of ecommerce merchants, 7 percentage points ahead of Wix in second place with 23% and Squarespace in third with 16% of the market. (Source: Builtwith.)
- WordPress is the most popular website building software in the world, with around 35 million sites built on the platform. However, it does not feature any built-in ecommerce functionality. Instead, WordPress users need to install third-party ecommerce plug-ins to facilitate ecommerce selling. WooCommerce absolutely dominates this plug-in market, possessing a 93% share among the top million sites. Ecwid’s plug-in option comes a distant second with a 5% market share.(Source: Builtwith.)
Ecommerce marketplace statistics
An ecommerce marketplace (also know as an ‘online marketplace’) is a website that offers lots of different products from a large variety of brands and sellers. Amazon, eBay and Etsy are some of the best known ecommerce marketplaces — each with millions of customers and hundreds of millions of products in their inventories.
Let’s take a look at some of the top statistics in the booming world of ecommerce marketplaces.
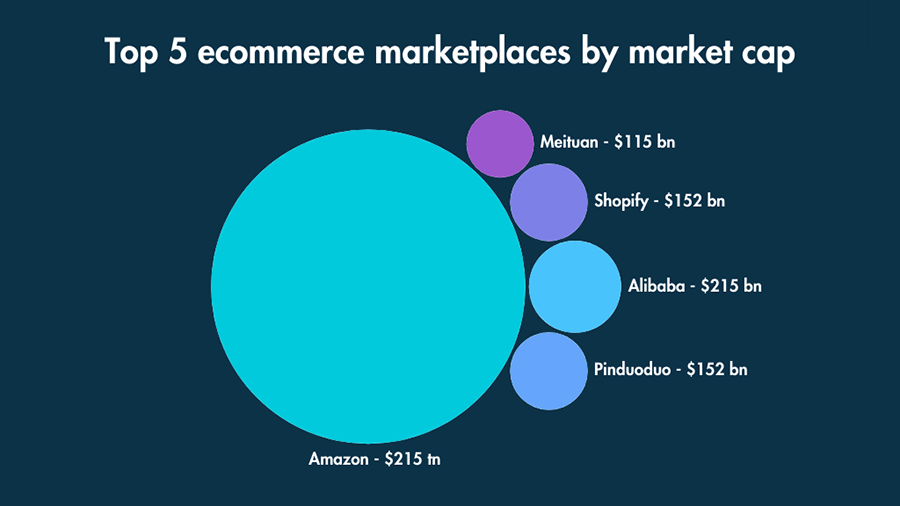
- Amazon is the largest ecommerce marketplace in the world with a market capitalization of 2.5 trillion US dollars. China’s Alibaba is ranked second with a market cap of $215 billion, followed another Chinese marketplace Pinduoduo in third place: ($152 billion). Canadian Shopify’s $152 billion valuation puts it in fourth place, 35 billion dollars ahead of Meituan with its $115 billion valuation in 5th place. (Source: Companies Market Cap.)
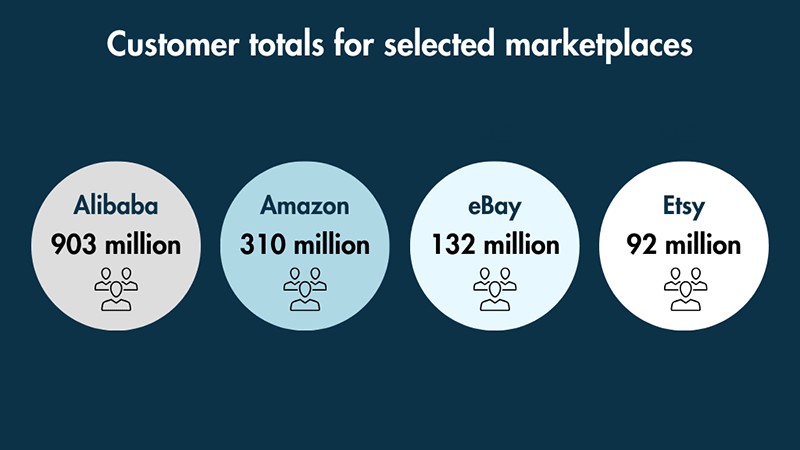
- Alibaba is the marketplace with the most amount of active customers. The Chinese ecommerce giant has a massive 903 million customers, almost three times that of Amazon’s 310 million. eBay’s active customer base is 133 million customers and Etsy has 92 million active buyers. (Sources: Statista, Jungle Scout, eBay and Etsy.)
- In 2023, Amazon total sales were $574.8 billion. (Source: Amazon.)
- In the third quarter of 2024 alone, Amazon net sales were $159 billion. (Source: Statista.)
- A reported 55% of businesses selling through online marketplaces have a profit margin of more than 20%. (Source: BigCommerce.)
- Amazon has 3.81 billion unique monthly visitors, which is more than 4 times that of eBay’s total of 901 million visitors each month. (Source: Semrush.)
- When it comes to the total numbers of customers for some of the top online marketplaces, Alibaba has a commanding lead with 1.3 billion customers compared to Amazon’s 310 million strong customer base. Other notable performers include eBay with 133 million customers, and Etsy, which has 96 million shoppers. (Sources: Alibaba, Statista and eBay.)
- In the US, Amazon is the top marketplace performer when it comes to ‘average visit duration’, with Amazon customers spending an average of 6:32 minutes on the site per visit. (Source: Similarweb.)
- eBay and Etsy customers also spend significant amounts of time on these marketplaces: eBay visitors spend 6:18 minutes per visit and Etsy visitors spend 5:20 minutes. (Source: Similarweb.)
- The average number of page views per visit on Amazon is 9.07, compared to 6.73 pages per visit on eBay and 6.13 pages per visit on Etsy. (Source: Similarweb.)
- eBay has over 2.1 billion live listings. (Source: eBay.)
- The top marketplace seller on the Etsy marketplace is PlannerKate1 with over 2 million sales of stationery and stickers. (Source: Startupbonsai.)
What are the biggest ecommerce sectors?
- Fashion is the largest global ecommerce sector, with estimated revenue of $888.56 billion in 2024 (Source: Dash.)
- ‘Consumer Electronics’ and ‘Toys, Hobby & DIY’ are the second and third largest ecommerce sectors with $765.7 billion and $601.7 billion in revenue respecitively. (Source: Dash.)
Social media ecommerce statistics
Social ecommerce refers to the selling and promotion of ecommerce products through social media apps such as Instagram, Facebook, TikTok, Pinterest and many more.
In 2024, worldwide global social commerce sales were estimated to be worth around $700 billion; a figure which is projected to more than treble to $2.9 trillion over the coming years. (Source: Statista).
Social ecommerce is getting BIGGER!
Let’s find out why.
- There are currently over 5.2 billion social media users around the world, which is forecast to rise to 5.8 billion by 2027. (Source: Datareportal.)
- 9 out of 10 people purchase goods and services from companies they actively follow on social media. (Source: Marketing Dive.)

- 46% of Chinese and 36% of American social media users make purchases through their social media accounts. (Source: Statista.)
- Between 2020 and 2022, social commerce sales in the United States are estimated to have doubled from $26.9 billion to around $56 billion.(Source: Insider Intelligence.)
- Across the many social media channels, TikTok is the app with the highest percentage of users who shop online very regularly through the platform. Over one fifth (20.6%) of TikTok users report that they make purchases through the app ‘all the time’. (Source: Insider Intelligence.)
- However, Instagram, Facebook and YouTube users are also extremely engaged social shoppers: 72.2% of Instagram users reportedly make online purchases through the app ‘all of the time’ or ‘sometimes’; while the equivalent figures for YouTube and Facebook users are 70.6% and 64.3% respectively. (Source: Insider Intelligence.)
- More than 58% of TikTok users look for shopping ideas on the platform, and 61% have bought something through the platform. (Sources: Statista and TikTok.)
- The TikTok #TikTokMadeMeBuyIt tag had over 29.1 billion views by the end of December 2022. (Source: Insider Intelligence.)
- By 2023, China’s live-streaming commerce market reached nearly five trillion yuan—a twelvefold increase since the pre-pandemic period. Approximately 60% of Chinese online shoppers participated in live commerce that year, with projections suggesting over 430 million users by 2026. This rapid growth has inspired countries like India, Thailand, and Brazil to embrace live commerce, while Europe remains slower to adopt this trend. (Source: Statista.)
- Douyin, TikTok’s Chinese counterpart, achieved a 40-fold increase in live commerce transaction value between 2019 and 2022. TikTok is now expanding its e-commerce capabilities globally through TikTok Shop, enabling direct in-app purchases and tapping into the growing popularity of social media for live shopping events. (Source: Statista.)
How much ecommerce fraud is there?
- In 2022, ecommerce fraud was responsible for losses of around $41 billion globally, an increase of $21 billion on the previous year. (Source: Statista.)
- Ecommerce fraud is expected to increase to $48 billion by the end of 2023. (Source: Statista.)
- 29.8% of ecommerce fraud attacks are due to ‘account takeovers’, and 24.1% of fraud attacks are as a result of people posing as bots. (Source: Finances Online.)
- The median loss per online purchase scam was estimated to be $101 in 2022, an increase of $5 on the previous year. It is projected that this figure will rise to $114 per scam by the end of 2023. (Source: Statista.)
Ecommerce search behavior statistics
- In 2022, a massive 80% of shoppers said that they had done research or browsed online before making a a purchase, while only 20% of shoppers said that they made impulse purchases. (Source: Google.)
- 56% of in-store shoppers reported using their smartphones to research items while inside a physical store. (Source: Google.)
- 86% of shoppers said that they use web sources to help them carry out research for their online purchases. (Source: Google.)
- Google reports that searches for ‘cheap electric cars’ and ‘cheap holidays’ have grown by 50% and 400% respectively over the last year. (Source: Google.)
- People looking to buy high-end fashion online are also looking for good value — the search term ‘designer outlet’ has seen a 90% rise in the last 12 months. (Source: Google.)
Mobile ecommerce statistics
- The volume of worldwide ecommerce sales on mobile phones and tablets is predicted to represent 43.4% of total ecommerce sales in 2024. (Source: Insider Intelligence.)
- Global smartphone users spent over 100 billion hours on shopping-related mobile apps in 2021, up 18% on the previous year. (Source: data.ai.)
- More than 79% of mobile users made an online purchase on their phones between July and December 2022. (Source: OuterBox.)
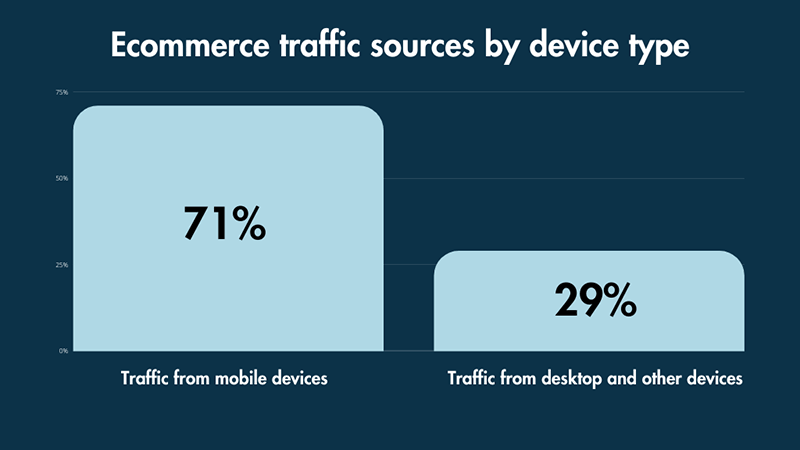
- 71% of traffic to ecommerce sites comes from mobile phones, compared to just 29% on desktop and other devices. (Source: SaleCycle.)
- However, ecommerce conversion rates on mobile devices are lower on mobile (2%) than on desktop (3%). (Source: Statista.)
- In the United States, 46.9% of ecommerce shoppers on mobile devices are aged between 18-24; 25-34 year olds also make up a large slice of this market, representing 31.8% of mobile shoppers. (Source: Statista.)
- Mobile commerce currently represents 65% of all commerce sales in the US, a figure which is projected to rise to 8.6% by 2026. (Source: Insider Intelligence.)
- When shopping on mobile devices, more and more consumers are making use of ‘digital wallet’ payment apps. By 2022, digital and mobile wallets accounted for roughly half of all global ecommerce payment transactions. (Source: Statista.)
- Internationally, the two leading digital wallet companies are both Chinese: AliPay and WeChat Pay. AliPay has approximately 650 million users and WeChat Pay has around 550 million users. (Source: Business of Apps.)
- In the US, Apple Pay is the digital wallet market leader with 43.9 million users (roughly 18 million users more than Google Pay). Perhaps surprisingly, Starbucks’ digital wallet is the second most popular among US users, with over 31.2 million Americans using the service. (Source: Business of Apps.)
- Apple Pay is used by more than 500 million consumers worldwide, while Google Pay has in excess of 400 million users. (Source: Business of Apps.)
Ecommerce advertising statistics
- The digital advertising market is thought to be worth $740.3 billion, with the largest segment being ‘search advertising,’ estimated to have a market volume of $306.7 billion this year. (Source: Statista.)
- The US generates the largest digital ad spend (42% of all online ads) — totalling around $298 billion in 2024. (Source: Statista.)
- $295 billion was spent on mobile advertising in 2021, representing a year on year increase of 23%. (Source: data.ai.)
- Over 30% of products advertised in ‘pay per click’ campaigns are on sale. In the case of Fashion products and Health and Beauty products, up to 37% of products featured in ads feature discounted pricing. (Source: User Guiding.)
- Remarkably, 16% of ecommerce products advertised globally are actually out of stock. (Source: User Guiding.)
- 99.01% of all products advertised online are categorized as ‘new’. However, in the electronics sector — computers, phones, audio equipment , etc. — almost 18% of advertised products are listed as either used or refurbished. (Source: User Guiding.)
- 34.68% of ads for video game consoles are for previously used items. (Source: User Guiding.)
Ecommerce marketing statistics
- Blogging is one of the most popular forms of content marketing: more than 75% of Fortune 500 companies have a public facing blog on their website. (Source: Statista.)
- Email is currently used by an estimated 4.3 billion people in the world today and user numbers are still growing. In 2025, it is estimated that there are be around 4.6 billion email users across the globe sending 376 billion emails per day. (Source: Statista.)
- Email is the third most popular channel for distributing digital marketing content (behind company websites and blogs), with 69% of marketers and brands employing email newsletters in their marketing activities. (Source: Content Marketing Institute.)
- Of the many industries using email marketing, ecommerce ranks highest when it comes to return on investment (‘ROI’) — for every dollar invested in an email marketing campaign, ecommerce companies earn $45 on average. (Source: Statista.)
- Emails sent by companies with an ecommerce focus have an average open rate of 15.68%, and a click rate of 2.01% (Source: Mailchimp.)
- In 2021, the average time for consumers to read an email received from a brand was10 seconds. (Source: Statista.)
- Video is fast becoming a highly-utilized form of content marketing for all brands including ecommerce ones. 78% of content marketers expect their companies to invest in video content in 2024. (Source: Content Marketing Institute.)
Ecommerce shipping statistics
- 88% of online shoppers prioritise ‘free’ shipping over ‘fast’ shipping, with 66% of shoppers willing to wait 3-7 days for their goods. (Source: Deloitte.)
- 69% of shoppers buying from an online retailer say that if their purchased item arrives more than two days after its expected delivery date, they are unlikely to shop with that retailer again. (Source: Ready Cloud.)
- Expensive shipping is among the top reasons for shopping cart abandonment. (See the Ecommerce abandoned cart statistics section below for more details.)
- Between 2014 and 2021, global parcel shipping volumes increased from 43 billion parcels to 159 billion parcels per year. China is leagues ahead of all other countries when it comes to parcel shipping volumes — 108 billion parcels were shipped in China in 2021 compared to 22 billion in the US and 9 billion in Japan. (Source: Statista.)
Ecommerce abandoned cart statistics
Cart abandonment refers to a situation where an ecommerce store visitor adds an item to their shopping cart, but exits the store without completing their purchase.
- According to the Baymard Institute, the average cart abandonment rate is 70.19%. (Source: Baymard Institute.)
- The biggest reason for cart abandonment according to 48% of online shoppers is the expensive nature of extra costs — shipping, taxes, fees, etc. — that get added to a purchase as a store visitor goes through the checkout process. (Source: Baymard Institute.)
- One quarter of online shoppers report abandoning their carts when asked to create an account with a website. (Source: Baymard Institute.)
- 25% of shoppers say that they abandon their carts due to not trusting ecommerce sites with their credit card information. (Source: Baymard Institute.)
- Slow delivery of goods is the fourth biggest reason for cart abandonment: 24% of online shoppers in the US left the checkout process due to unsatisfactory delivery speed. (Source: Baymard Institute.)
See below for the full top ten list of reasons for ecommerce cart abandonment.
| 1 | Extra costs too high (shipping, taxes, fees) | 48% |
| 2 | The site wanted me to create an account | 26% |
| 3 | I didn’t trust the site with my credit card information | 25% |
| 4 | Delivery was too slow | 23% |
| 5 | To long / complicated credit card information | 22% |
| 6 | I couldn’t see / calculate total order cost up-front | 21% |
| 7 | Returns policy wasn’t satisfactory | 18% |
| 8 | Website had errors / crashed | 17% |
| 9 | There weren’t enough payment methods | 13% |
| 10 | The credit card was declined | 9% |
Ecommerce dropshipping statistics
Dropshipping is a form of ecommerce where you don’t manufacture, store or ship any goods yourself. Instead you you take orders for products via an online store, and pass them onto your supplier. The supplier then charges you, and sends the goods to the customer.
- In 2025, the dropshipping market is currently worth an estimated $372.47 billion, with forecasters expecting this figure to increase to $476.10 billion in 2026. (Source: Statista)
- The average profit margin for a dropshipping business is 15%-20%. (Source: BlueCart)
- Some commentators estimate that up to 27% of all online retailers use dropshipping as a business model. (Source: Ecommerce Platforms)
- There are currently around 638 dropshipping apps available for Shopify, 160 for WordPress, 28 for BigCommerce and 65 for Wix (Sources: Shopify, WordPress, BigCommerce and Wix).
Is print-on-demand profitable in 2025?
‘Print-on-demand’ (POD) is a form of dropshipping where products are sourced from a dedicated supplier of printed goods — items sold using POD typically include posters, apparel and wall art.
Instead of producing and storing large quantities of printed inventory in advance, POD allows for individual items to be produced as needed, typically using digital printing techniques. This approach reduces costs, minimizes waste, and allows full customization of products.
- Some print-on-demand industry observers report the average profit margin for print-on-demand business to be between 15% and 20%. (Source: Teeinblue.)
- The print-on-demand market was valued at approximately $4.1 billion in 2021 and is projected to be worth $39.87 billion by 2030, which represents a predicted compound annual growth rate (CAGR) of around 26.2%. (Source: Straits Research.)
- The home decor segment of the print-on-demand market is expected to see the highest growth rate in the POD sector, with an estimated CAGR of 27.7 over 2022 and 2023. (Source: Straits Research.)
- 20% of POD customers are willing to pay at least 20% extra for personalized POD products. (Source: Com Cap.)
- 45% of Americans have a ‘side hustle’ in addition to their main job. (Source: CPA Practice Advisor.)
- In 2022, the custom t-shirt printing global market size was valued at $4.31 billion. (Source: Grand View Research.)
- Printful is one of the most popular POD apps in the Shopify app store. It has an overall user rating of 4.8 stars out of 5 (based on 5,786 reviews).
Ecommerce payment provider statistics
- Online payment gateway providers are expected to have earned $138 billion in fees in 2024. (Source: Insider Intelligence.)
- Paypal total is the most popular ecommerce payment transaction provider — it has over 431 million users. (Source: Business of Apps.)
- As of January 2025, Paypal is valued at $88.87 billion. (Source: Companies Market Cap and Macrotrends.)
- Irish-American payment company Stripe is presently valued at around $70 billion based. According to Builtwith, Stripe is currently implemented on 1,356,872 live websites . (Source: Kinsta and Builtwith.)
- The top 4 ecommerce payment providers in terms of market share are:
- PayPal — 45.16%
- Stripe — 17.72%
- Shopify Payments — 15.6%
- Amazon Pay — 2.6%
(Source: Datanyze.)
Ecommerce statistics for NFTs
‘Non-fungible tokens’ — NFTs for short — are a recent entrant to the world of ecommerce. Based on blockchain technology, an NFT is a unique, ‘uncopiable’ digital asset that can represent all sorts of collectible items such as art, music or games.
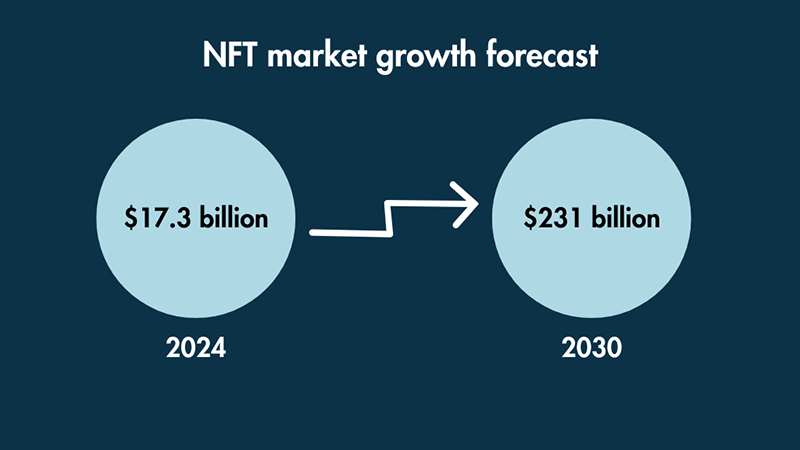
- The NFT market has a total market capitalization of $17.3 billion, with some forecasters predicting this could increase to $231 billion by 2030. (Source: New York Times and Nansen.)
- 50% of all recorded NFT sales are for items worth less than $200. (Source: Nansen.)
- The first NFT is widely regarded to be the artwork ‘Quantum,’ minted by digital artist Kevin McCoy and coder Anil Dash in May 2014. Seven years later, Quantum sold for $1.47 million at Sotheby’s. (Source: Sotheby’s.)
- The most expensive NFT ever sold is considered to be ‘The Merge’ by Pak, which sold for $91.8 million in December 2021. (Source: Metaroids.)
- In February 2021, the digital artwork ‘Everydays — The First 5000 Days” by Beeple was the first purely digital artwork sold by a major auction house. (Source: The New York Times.)
- NFTs are particularly popular in Asia: more than 12% of affluent Asian consumers have bought an NFT and people in China, Hong Kong and Singapore top make the highest number of Google searches for NFTs. (Sources: Influence Marketing Hub and Statista.)
- 4% of Americans own an NFT. (Source: Nansen.)
- 80% of people in the UK and 70% of Americans do not know what an NFT is. (Source: Nansen.)
Ecommerce forecast statistics
- Some forecasters project that ecommerce will represent 24% of global retail sales worldwide by 2026. (Sources: IRP and Statista.)
- Revenue from ecommerce sales in the ‘metaverse’ are projected to increase from $30.6 billion in 2024/2025 to a whopping $678.8 billion in 2023. (Source: Grand View Research.)
- In the United States, 97% of people own a smartphone and 35% of people own a ‘smart speaker’. The overall revenue of ecommerce purchases transacted by ‘voice shopping’ through devices of all types is expected to rise by $164 billion in 2024. (Sources: Finances Online, PEW research Center and Consulterce.)
Other interesting ecommerce facts
- The first genuine ecommerce transaction took place in 1994 when Dan Kohn sold a Sting CD online to his friend Phil Brandenburger. The transaction — for a sum of $12.84 — was reported by the New York Times with the headline “Attention Shoppers: Internet is Open”. (Source: Michael Tefula and The New York Times.)
- The largest ever single ecommerce transaction is reported to be the purchase of a Gulfstream V business jet by businessman Mark Cuban for $40 million in 1999. (Source: Guinness World Records.)
- Cruise and ferry operators take the booby prize when it comes to ecommerce cart abandonment rates — a staggering 98% of online transactions in this industry are abandoned. (Source: Statista.)
- 110,000 Etsy sellers sold at least one face mask during the COVID-19 pandemic, resulting in over $346 million worth of mask sales on the marketplace. (Source: Digital Commerce 360.)
- Products sold via ecommerce can potentially be handled 20 times or more by the time they are delivered to the customer. (Source: Ameripen.)
- Ecommerce presents something of a spelling conundrum for writers — there are no less than 6 different forms of the word in use today: ‘e-commerce,’ ‘E-commerce,’ ‘ecommerce,’ ‘Ecommerce,’ ‘eCommerce’ and ‘e commerce’. (Source: The Future of Commerce.)
Other ecommerce resources and statistics from Style Factory
Ecommerce
- Ecommerce glossary — an A-Z of key ecommerce terminology
- Ecommerce platform reviews — our take on the most popular ecommerce platforms
- Ecommerce platforms — buyer’s guide — the key things you need to know before subscribing to an online store builder app
Statistics
- Canva statistics — key facts and figures about a leading design tool.
- ChatGPT statistics — data relating to the increasingly popular AI chatbot, ChatGPT.
- Shopify statistics — key facts and figures about one of the web’s most popular ecommerce platforms.
- Squarespace statistics — key facts and figures about a hugely popular drag-and-drop website builder.
- Wix statistics — key facts and figures about this leading store and site builder.
No comments